Locust is an easy to use, scriptable and scalable Web performance testing tool. You define the behaviour of your users in regular Python code, which makes Locust infinitely expandable and very developer friendly.
The idea is that during a test, a large number of simulated users (“locusts”) will send requests to your website. The behavior of each user is defined by you and the overall process is monitored from a web UI in real-time. This will help you battle test and identify bottlenecks in your code before letting real users in.
To run Locust, we need a “web server” whose performance we want to test. In our “locust” container, we have already included a simple web server that you can use in following this tutorial. To start the web server, run the following command in the container:
$ simple-server
There should be a message indicating that the server started on port 3000.
Unfortunately, the server runs in the foreground by default, so you will need to terminate it first if you want to execute a command (like ls) in the container, at which
point the server is no longer available.
There are two possible solutions for this situation:
Start the server in the background through the following command:
$ simple-server > /dev/null &
The command > /dev/null silences the output and & executes the command in a child process detached from the current shell, so that you are not stuck waiting for the completion of the process. Now you should be able to issue a command.
Start another shell (either using tmux or by the docker exec -it locust /bin/bash command), and issue your next command in the new shell.
Using one of the above two methods, make sure that your server is running in the container and you still have an interactive shell through which you can issue commands inside the container.
Now that you have our test server running, let us run our first Locust performance test on the server. We have created a simple “locust file”, locustfile.py. Download the file and start a Locust Web UI server based on the downloaded file:
$ locust -f ./locustfile.py --host=http://localhost:3000
The above command specifies the “locust file” (-f), which defines the “behavior of the user” such as how many requests are issued at what intervals, etc. It also specifies the website address that we test (--host), which is the port 3000 at http://localhost in our example.
When you execute the above command, you are likely to see the following output, which means that Locust Web UI is now running.
[2021-04-21 20:30:06,201] 46d3e53a99d9/INFO/locust.main: Starting web interface at http://0.0.0.0:8089 (accepting connections from all network interfaces)
[2021-04-21 20:30:06,210] 46d3e53a99d9/INFO/locust.main: Starting Locust 1.4.3
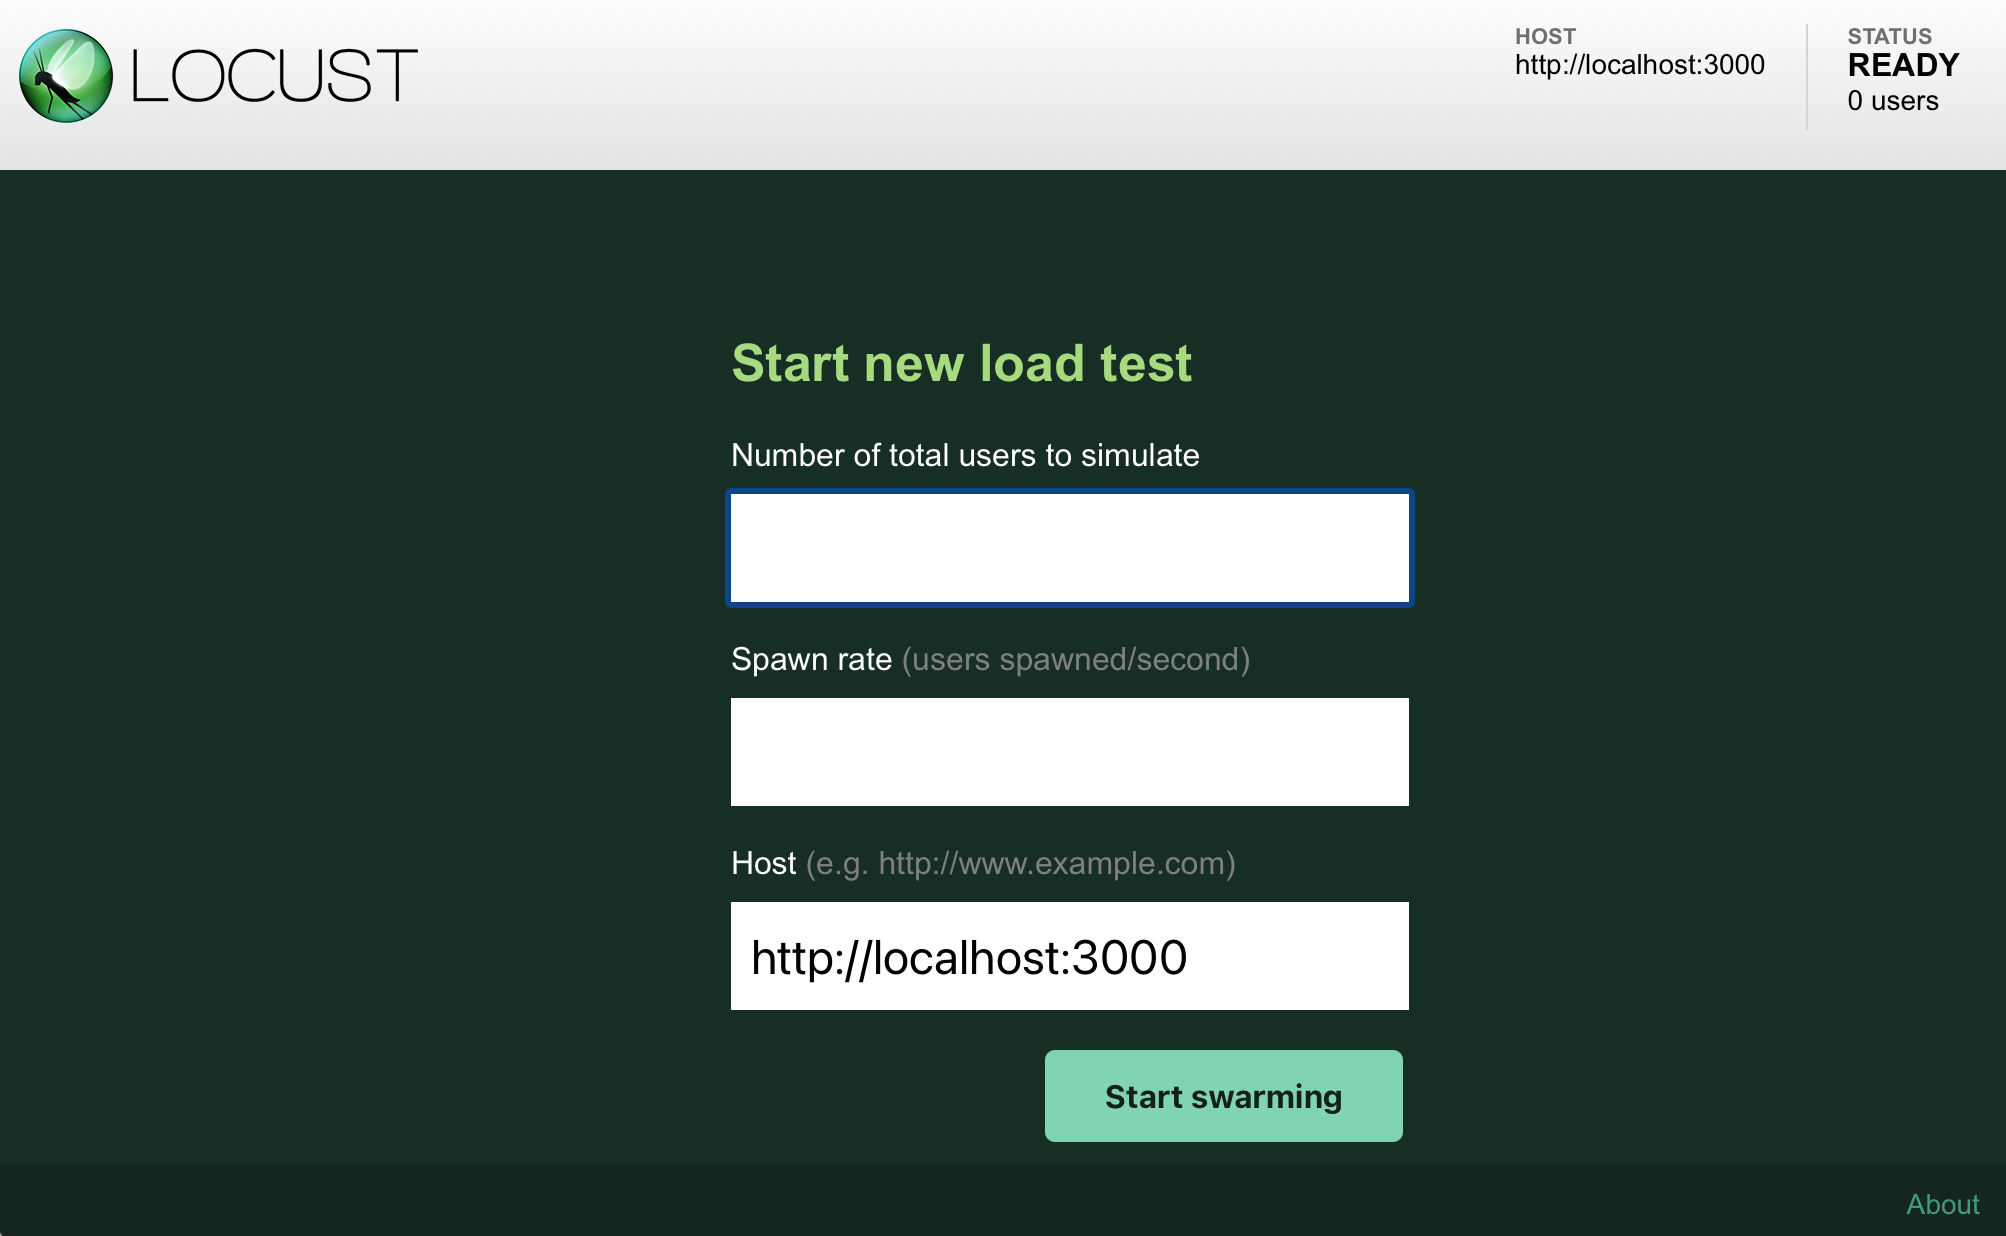
Now, open a browser in your host machine and go to http://localhost:8089. You should be greeted with the following Locust UI asking you to “Start new Locust swarm”:

Type in the number of users you want to simulate, say 200, and specify the spawn rate, say, 100. Here, the “number of user to simulate” means how many concurrent users Locust should simulate when it performs load testing. The “spawn rate” means the speed at which these users are created in the beginning until the specified number of concurrent users are created. (Due to the limitation of CPU performance of your machine, the actual rate might be smaller than the number you specify.)
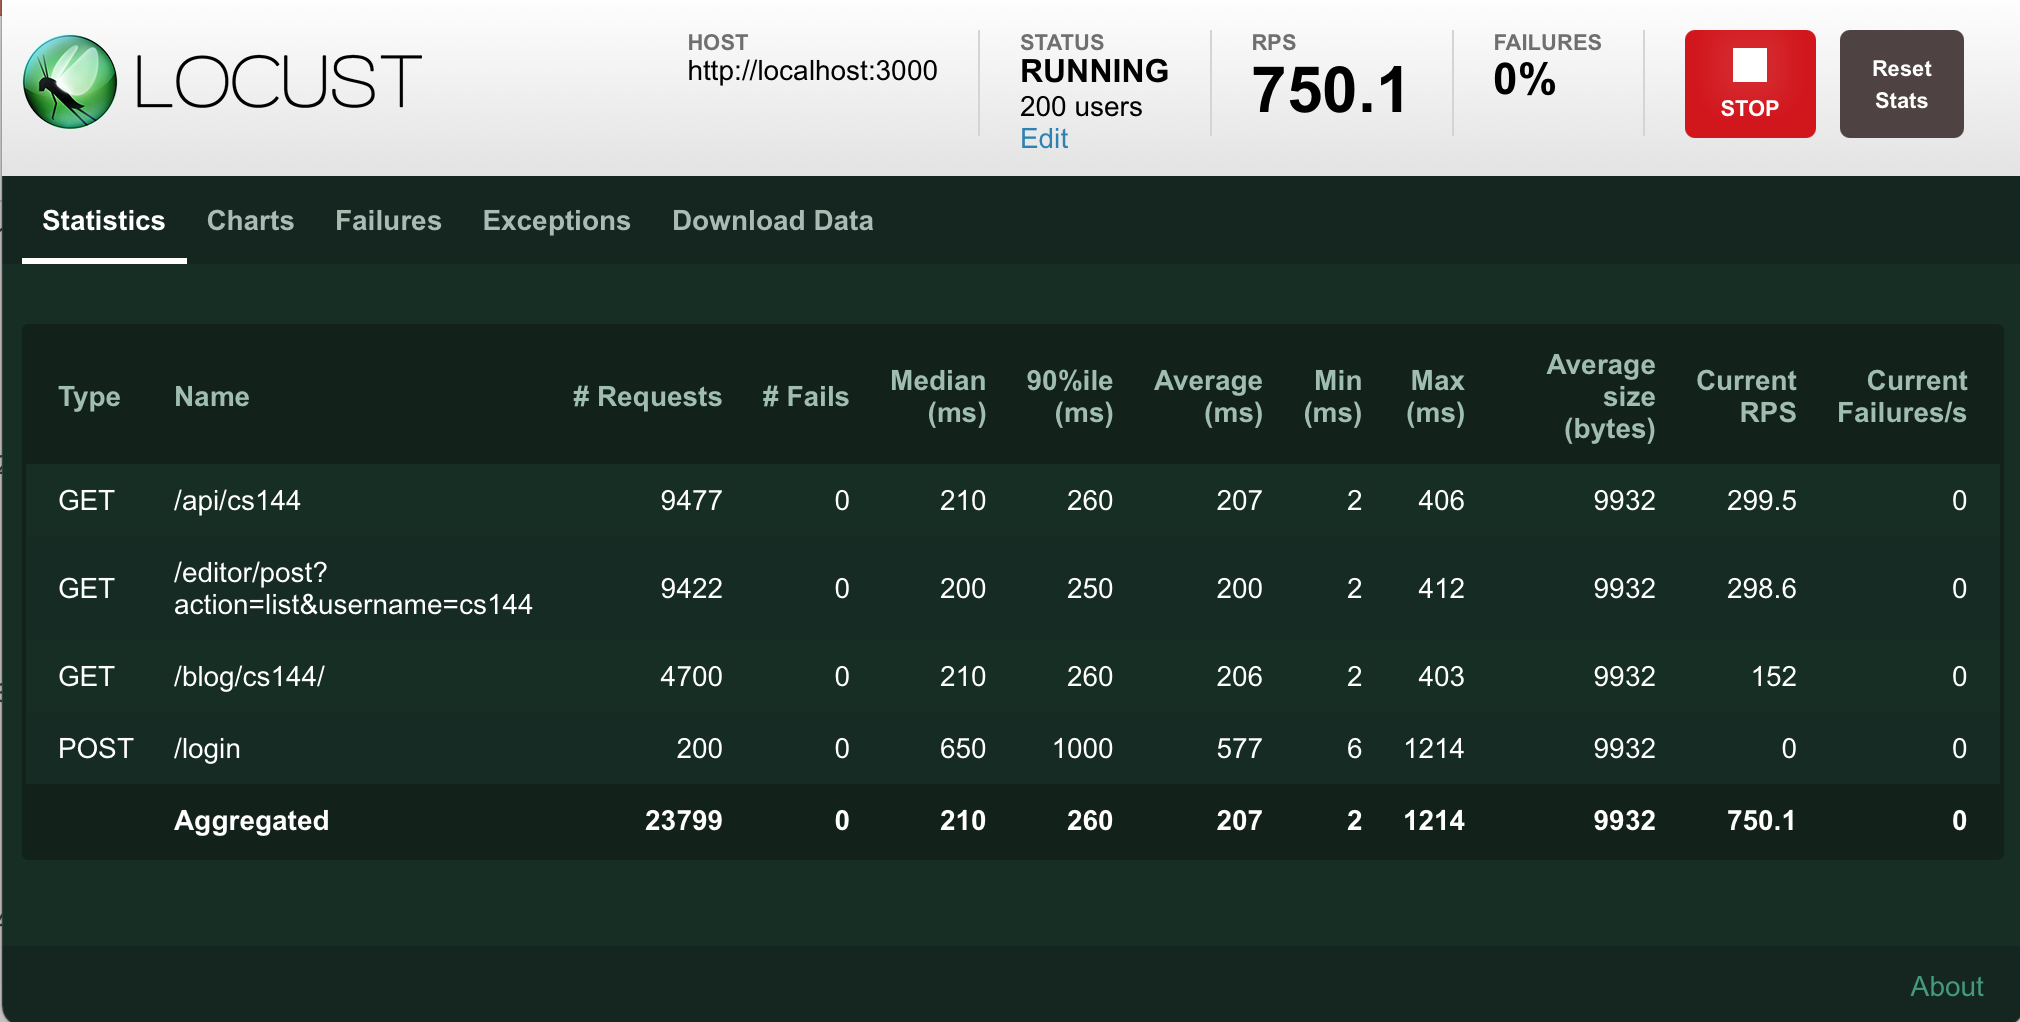
Now click start and see what happens. The UI will show real-time statistics on how the server responds to the requests sent by Locust:

Here is more explanation on what the information on this page means:
| Term | Meaning |
|---|---|
| Host | The address of website that we test against. (http://localhost:3000 in our case) |
| Status | The status shows “SPAWNING” in the beginning when new users are spawned, but once the specified number of users have been spawned, the status changes to “RUNNING” and shows the number of concurrent users, 200 in our example. |
| RPS | Requests per second. It shows how many HTTP requests are currently being sent to the server. |
| Failures | The percentage of requests that fails due to a connection error, timeout, page not found, bad request or similar reason. The absolute number and reason for failures are recorded in failures tab. |
| Stop | You can press this button to stop the ongoing test. |
| Reset Stats | If you click this button, all stats will be reset to zero. |
| Median, 90 percentile, Average, Min, Max | These columns show the server response time, the interval between when the request is sent from Locust and when it receives the response from the server. |
| Average size | This column shows the average response size from the server |
| Current RPS, Current Failures/s | These columns show how many requests are being sent to the server currently and how many failures it gets |
By running Locust with different numbers of users and looking at the statistics, you can measure how well the server performs under different load conditions. Change the number of users, say to 500, and rerun the tasks to see how the performance changes. Play with the UI and get yourself familiar with the Locust UI.
Now that you are familiar with what Locust can do, let us learn how to write a locust file that describes the set of the tasks to be run for performance test. Before you proceed, take a quick look at our sample locust file, locustfile.py, to get a sense of what the file looks like:
import sys, time, random
from locust import HttpUser, task, between

class MyUser(HttpUser):
    wait_time = between(1, 2.5)

    @task
    def list(self):
        self.client.get('/api/posts?username=user2')
        self.client.get('/editor/post?action=list&username=user2')

    @task(2)
    def preview(self):
        # generate a random postid between 1 and 100
        postid = random.randint(1, 100)
        self.client.get("/blog/user2/" + str(postid), name="/blog/user2/")

    def on_start(self):
        """on_start is called when a Locust start before any task is scheduled"""
        res = self.client.post("/login", data={"username":"user2", "password": "blogserver"})
        if res.status_code != 200:
            print("Failed to authenticate the user2 user on the server")
            sys.exit();
Note: Fortunately, you don’t need to know many details of the Python language to use Locust, but in case you never used Python before, you may want to read this Python tutorial to learn the basic.
import sys, time, random
from locust import HttpUser, task, between
A locust file is just a normal Python module, it can import code from other files or packages.
class MyUser(HttpUser):
Here we define a class for the users that we will be simulating. It
inherits from HttpUser which gives each user a client attribute, which is an instance of HttpSession, that can be used to make HTTP requests to the target system
that we want to load test. When a test starts, locust will create an
instance of this class for every user that it simulates, and each of
these users will start running within their own green gevent thread.
wait_time = between(1, 2.5)
Our class defines a wait_time that
will make the simulated users wait between 1 and 2.5 seconds after each
task (see below) is executed. For more info see wait_time
attribute.
@task
def list(self):
    self.client.get('/api/posts?username=user2')
    self.client.get('/editor/post?action=list&username=user2')
Methods decorated with @task are the
core of your locust file. For every running user, Locust creates a
greenlet (micro-thread), that will call those methods.
@task
def list(self):
    ...

@task(2)
def preview(self):
    ...
We’ve declared two tasks by decorating two methods with
@task, one of which has been given a
higher weight (2). When our MyUser runs it’ll pick one of the declared tasks - in this case
either list or
preview - and execute it. Tasks
are picked at random, but you can give them different weighting. The
above configuration will make Locust twice more likely to pick
preview than
list. When a task has finished
executing, the User will then sleep during it’s wait time (in this case
between 1 and 2.5 seconds). After it’s wait time it’ll pick a new task
and keep repeating that.
Note that only methods decorated with @task will be picked, so you can define your own internal helper
methods any way you like.
self.client.get('/api/posts?username=user2')
The self.client attribute makes it
possible to make HTTP calls that will be logged by Locust. For
information on how to make other kinds of requests, validate the
response, etc, see Using the HTTP Client.
@task(3)
def preview(self):
    # generate a random postid between 1 and 100
    postid = random.randint(1, 100)
    self.client.get("/blog/user2/" + str(postid), name="/blog/user2/")
In the preview task we use 100
different URLs by by selecting a random postid between 1 and 100. In order to not get
100 separate entries in Locust’s statistics - since the stats is grouped
on the URL - we use the name parameter to group all those requests under an entry named
"/blog/user2/" instead.
def on_start(self):
    """on_start is called when a Locust start before any task is scheduled"""
    res = self.client.post("/login", data={"username":"user2", "password": "blogserver"})
    if res.status_code != 200:
        print("Failed to authenticate the user2 user on the server")
        sys.exit();
Additionally we’ve declared an on_start method. A method with this name will be called for each simulated user when they start. For more info see on_start and on_stop methods.
You can run locust without the web UI by using the --headless flag together with -u and -r:
$ locust -f ./locustfile.py --host=http://localhost:3000 --headless -u 100 -r 100
The --headless in command indicates that we would disable the web UI and run it immediately within console. -u specifies the number of Users to spawn, and -r specifies the spawn rate (number of users to start per second).
When you execute the above command, Locust will start the test and print out the stats in every 2 seconds until you it is stopped via “Ctrl+C”.
[2021-04-22 09:34:24,116] 46d3e53a99d9/INFO/locust.main: No run time limit set, use CTRL+C to interrupt.
[2021-04-22 09:34:24,116] 46d3e53a99d9/INFO/locust.main: Starting Locust 1.4.3
[2021-04-22 09:34:24,117] 46d3e53a99d9/INFO/locust.runners: Spawning 100 users at the rate 100 users/s (0 users already running)...

[2021-04-22 09:34:25,211] 46d3e53a99d9/INFO/locust.runners: All users spawned: MyUser: 100 (100 total running)
 Name                                       # reqs   # fails | Avg Min Max Median | req/s failures/s
-----------------------------------------------------------------------------------------------------
 GET /api/posts?username=user2                  85  0(0.00%) |   2   1  13      2 |  0.00    0.00
 GET /blog/user2/                               64  0(0.00%) |   2   1  13      2 |  0.00    0.00
 GET /editor/post?action=list&username=user2    85  0(0.00%) |   2   1  10      2 |  0.00    0.00
 POST /login                                   100  0(0.00%) |   8   1 104      2 |  0.00    0.00
-----------------------------------------------------------------------------------------------------
 Aggregated                                    334  0(0.00%) |   4   1 104      2 |  0.00    0.00
...

KeyboardInterrupt
2021-04-22T16:35:01Z
[2021-04-22 09:35:01,697] 46d3e53a99d9/INFO/locust.main: Running teardowns...
[2021-04-22 09:35:01,698] 46d3e53a99d9/INFO/locust.main: Shutting down (exit code 0), bye.
[2021-04-22 09:35:01,698] 46d3e53a99d9/INFO/locust.main: Cleaning up runner...
[2021-04-22 09:35:01,699] 46d3e53a99d9/INFO/locust.runners: Stopping 100 users
[2021-04-22 09:35:01,713] 46d3e53a99d9/INFO/locust.runners: 100 Users have been stopped, 0 still running
 Name                                       # reqs   # fails | Avg Min Max Median |  req/s failures/s
------------------------------------------------------------------------------------------------------
 GET /api/posts?username=user2                1669  0(0.00%) |   2   1  24      2 |  44.43    0.00
 GET /blog/user2/                              854  0(0.00%) |   2   1  13      2 |  22.73    0.00
 GET /editor/post?action=list&username=user2  1669  0(0.00%) |   2   1  27      2 |  44.43    0.00
 POST /login                                   100  0(0.00%) |   8   1 104      2 |   2.66    0.00
------------------------------------------------------------------------------------------------------
 Aggregated                                   4292  0(0.00%) |   2   1 104      2 | 114.26    0.00

Response time percentiles (approximated)
 Type  Name                                    50% 66% 75% 80% 90% 95% 98% 99% 99.9% 99.99% 100% # reqs
-----|----------------------------------------|---|---|---|---|---|---|---|---|-----|------|----|------|
 GET   /api/posts?username=user2                 2   2   3   3   4   5   6   8    21     25   25   1669
 GET   /blog/user2/                              2   2   3   3   3   4   5   7    13     13   13    854
 GET   /editor/post?action=list&username=user2   2   2   2   3   3   4   5   7    21     27   27   1669
 POST  /login                                    2   3   3   4  18  64  98 100   100    100  100    100
-----|----------------------------------------|---|---|---|---|---|---|---|---|-----|------|----|------|
 None  Aggregated                                2   2   3   3   3   4   6   9    64    100  100   4292
Let’s take a look at the last table, which describes the distribution of the response time. In the first row of table, we have 1669 requests sent to /api/posts?username=user2 using the GET method that received responses, among which 50% of requests are responded in 2ms, 90% are responded in 4ms, and 99% are within 8ms. Let’s say if the response time is required to be less than 10ms, our website handles 99% of the users within this limit while 100 users are visiting the website every second.
In your results, the number of requests for GET /api/posts?username=user2 is different from that of GET /editor/post?action=list&username=user2. This may happen because Locust only counts the requests that have been responded, otherwise those requests wouldn’t have stats of response time. When time is up, Locust will simply stop counting, print the summary and exit even though some of the requests it sent haven’t been responded. And the reason why POST /login has exactly 100 requests is because one authentication is performed per each user.
When you want to run Locust using an automated script, it is useful to stop it by setting a time limit, as opposed to by pressing “Ctrl+C”. This can be done by using the -t option like the following:
$ locust -f ./locustfile.py --host=http://localhost:3000 --headless -u 100 -r 100 -t 30s
The above command will stop Locust testing after 30 seconds. In general, you can use a time format like XhYmZs (X hours, Y minutes and Z seconds).
It is also useful to know the --reset-stats option, which tells Locust to reset the data when the STATUS changes from “SPAWNING” to “RUNNING”. This option is sometimes useful because to get to the “RUNNING” stage as fast as possible, usually you need to ramp up your users quickly in “SPAWNING” stage. This often results in an unnaturally high stress on your server and possibly much higher response time and error rate than usual. Resetting the stats to zero once the initial ramp-up stage is over can prevent those ramp-up stats polluting the running stats.
Sometimes we don’t really need all the details when running the test, and the summary table printed at the end is sufficient to tell the whole story. We can run Locust without the web UI and save only the summary to the file summary.txt by the following command:
$ locust -f ./locustfile.py --host=http://localhost:3000 --headless --reset-stats -u 100 -r 100 -t 30s --only-summary |& tee summary.txt
The --only-summary option tells Locust to suppress the stats output during the test and only print the summary.
|& is a UNIX pipe to redirect STDERR and STDOUT of the Locust process to STDIN of the UNIX command tee. And the UNIX command tee would print all message to the console as well as saving the message in the file specfied as its parameter.
Now you have learned enough about Locust to finish this project. But if you want to learn more, check out the Locust documentation.
Before leaving this tutorial, stop our simple server with the following command if you ran it in the background:
$ pkill simple-server && pkill node